Tips & tricks · AI · Everywhere · ~days of research
Deep research: competitors and market, with citations
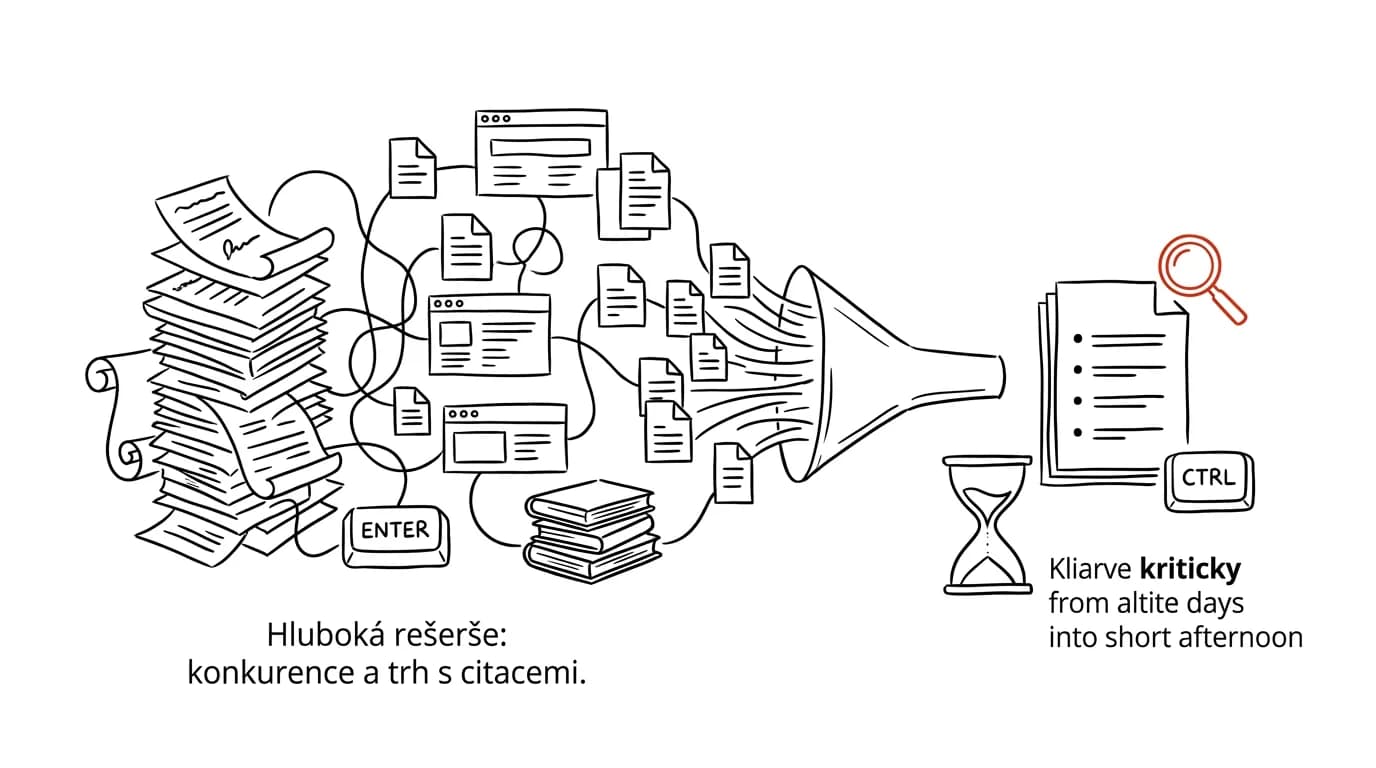
An ordinary AI chat answers from memory, in a few seconds. Deep research is something else: you ask a question, the tool plans out on its own what it needs to find, works through dozens of web sources, compares them, and returns a structured report with links showing where every claim comes from. It takes minutes instead of seconds — and replaces work a person would spend days on. The key isn't that AI reads faster than you. It's that it finds sources you'd never have thought to look for.
But an eight-page report full of links is material, not a decision. The difference between “I have something to work with” and “I have a nicely formatted mix of fact and invention” comes down to two things: how you framed the brief, and what you do with the report once it's done. A brief that doesn't aim at a decision returns an essay. A report nobody reads critically is just a longer version of a gut feeling.
This guide is a full workflow: from framing the research question, through the anatomy of a brief and reading the result critically, to five concrete use cases — market entry, a competitive map, pricing, a strategy brief, and supplier vetting — and finally, combining research with your company's own data, which is where most of the real value shows up. Every phase has prompts you can copy directly; just fill in the brackets.
A typical scenario
Mark runs a small Czech company selling DIY supplies and is considering entering the Polish market. A proper investigation would mean a week of work: who's selling there, at what prices, through which channels, what the return policies look like, how big the market even is. In practice it would go differently — two hours of googling, three competitor websites, a gut-feel decision.
The first time, he gets it wrong. He types “competitors in Poland, DIY tools” and gets a report that's factually fine and useless: a generic market description, a list of fifteen companies from global chains to local online shops, three paragraphs on the growing popularity of DIY. None of it tells him whether to enter.
The second time, he rewrites the brief. He states which decision it serves (enter with our own brand at a mid-tier price point, or not), for whom, at what scope (online channel only, hand tools only, the last two years), and what the output should look like (a table of players with positioning and price tiers, entry barriers, the three biggest risks). He adds a line telling the tool to say a claim has no traceable source rather than state it as fact.
He comes back from lunch to an eight-page report: seven major players with positioning, the three biggest e-commerce platforms in the country, a note on the requirements for selling into Poland, and a segment-size estimate with two different figures from two sources — which is itself useful information. Mark then spends an hour clicking through the citations behind the numbers he cares about. Two check out, one points to an old article, and one links to a page where the claimed figure isn't there at all. He then runs a second round targeted at the gaps: price tiers for two players the report was vague on, and return policy rules.
The result: material where he knows which number is verified and which is an estimate. A week of work shrank to an afternoon — not because the AI decided for him, but because it gave him a map that also shows the blank spots.
Phase 1: the decision first, the question second
The most common reason deep research returns an unusable report isn't a weak tool or bad phrasing — it's that whoever asked for it didn't know what they needed the report for. Research with no decision behind it sprawls sideways, because there's nothing to determine what actually matters.
Three questions to answer beforehand
Before you write the first word of the brief, answer three things for yourself. It takes ten minutes and saves the entire research run.
What decision does this serve? Not “I want to know more about the market,” but “I'm deciding whether to launch sales in Poland by the end of the quarter, or push it back a year.” The decision determines what matters in the report: for market entry, barriers and costs are key; for pricing, it's competitors' price tiers. Same topic, different report.
For whom? Who's going to read the report, and what they already know about the topic. A report for yourself can be dense and technical. A report for a leadership meeting needs a half-page summary up top and numbers that hold up when someone questions them.
At what scope? Segment, geography, period, channel. “Tools” is a different world from “hand tools for home DIY use sold online.” Better to set the boundaries narrow — you can widen them in a second round, but you can't narrow them after the fact, because you still have to read the extra text.
If you can't answer these three questions, don't submit the research brief yet. Get help scoping it first:
I'm weighing [decision I'm facing] and want to research it.
Context: [company / industry / size / market I operate in].
What I already know: [2-4 sentences on what I've already got].

Don't search anything yet. Help me scope the brief:
1. Rephrase my decision so it's clear which options I'm choosing
   between and what distinguishes them.
2. List what information would have to be missing for me to
   decide wrong — ranked from most important.
3. Suggest 3 different scopes for the research (broad, medium,
   narrow), and for each, state what it will and won't answer.
4. Write down what I probably won't be able to find out from
   public sources at all, and where I'll have to find it instead.

Be specific, no generic advice about the importance of data.
You'll get three brief variants and, importantly, a list of what public research can't carry. Point 4 is the most valuable — it typically turns out that some of your questions can't be answered from the web and you'll need a phone call, an industry contact, or your own data. Better to know that up front than after an hour of reading the report.
A research question instead of a topic
A topic is an area. A question is something that has an answer. “Competitors in Poland” is a topic. “Which hand-tool retailers for home DIY use have an online presence in Poland, what price tiers do they operate in, and what channels do they use” is a question.
A good research question meets three conditions: it's answerable (a type of source exists that contains it), the answer changes your decision (if it could come out any way and you'd do the same thing regardless, you don't need the question), and it's scoped in time, place, and segment.
My decision: [decision].
My context: [company, industry, size, market].

Suggest 5 variants of a research question for deep research.
For each, state:
- the exact wording of the question (one sentence, not a
  run-on)
- what type of source would answer it (statistics, annual
  reports, price lists, industry analyses, user discussions,
  legislation)
- how my decision would change depending on how the answer
  comes out
- how hard it will be to find out from public sources (easy /
  hard / probably unknowable)

Make the variants differ in angle, not just wording. At least
one should target risks, and at least one should target what
would have to be true for the decision to turn out wrong.
You'll get five comparable variants, from which you'll usually pick one primary and one supporting question. Take the difficulty rating with a grain of salt: the model labels things “easy” that are actually trade secrets in practice (competitors' margins, actual sales volumes).
Phase 2: the anatomy of a brief that returns a usable report
A brief has six parts. Skip one, and the model fills it in on its own — generically.
Six parts of a brief
- The question — specific, one sentence, scoped.
- Context and purpose — who's asking, for what decision, on what timeline.
- Boundaries — the time period for sources, geography, language, segment, and explicitly what you don't care about.
- Desired output — format, structure, length. A table, a list of risks, three scenarios, a summary for leadership.
- Rules for sources — what counts as an acceptable source, how to handle missing data, how to flag uncertainty.
- What to do with contradictions — show both numbers, don't average them.
The fourth and fifth parts are the ones most often left out. Without the fourth, you get an essay you'll rewrite anyway. Without the fifth, a report where you can't tell a documented number from an estimate.
A universal brief skeleton
This prompt is the base you'll adapt for every use case in Phase 4. It's worth saving among your prompts and reusing.
Do deep research on this question:
[exact wording of the research question].

Context: I'm a [role] at a [type of company, size, industry].
I need this research as material for deciding whether
[decision], and I'm deciding within [weeks / months].

Boundaries:
- geography: [country / region], flag data from other markets
  explicitly
- time period: primarily sources from the last [2] years; older
  only where nothing newer exists, and flag those
- segment: [exact scope], don't stray outside it
- not interested in: [what to leave out]

Output:
1. A half-page summary for someone who won't read the whole
   report — what I found and what it means for the decision
2. [Main body per the use case: a table of players / a price
   overview / a list of risks / ...]
3. What's certain, what's likely, and what's an estimate — three
   separate lists
4. What I wasn't able to find out, and why

Rules:
- cite a source and year for every factual claim
- where you don't have a source, write "no source" instead of
  stating it as fact; a shorter report beats a padded one
- distinguish primary sources (statistics, annual reports,
  official documents) from retellings; for retellings, look for
  the original source
- where sources disagree, show both numbers side by side and
  explain what accounts for the methodology difference — don't
  average them
- no recommendations like "the company should consider"; I want
  facts and interpretation, I'll make the decision myself
You'll get a report where the line between documented and estimated is visible. Sections 3 and 4 are what separates usable material from nicely written text — acknowledged uncertainty is information, hidden uncertainty is a risk. Watch out: the model sometimes labels a claim “certain” even when it's backed by only a single secondary source.
Let it run
Deep research runs for roughly minutes. It isn't a conversation, it's a task — submit it and go do something else. You'll ask follow-ups afterward, targeted at specific gaps.
If you need to run this kind of research repeatedly over the same context (your market, your company, your criteria), set up a project with persistent context — you won't have to retype the company description and criteria into every brief, and reports come out consistent.
Phase 3: what to do with the result
The report is done. This is where half the work begins that almost nobody does — and it's what decides whether the result is usable material or just an impression.
Critical reading: four passes
Don't read the report top to bottom like an article. Go through it four times, each pass with a different focus.
First pass: what actually answers my question? Take the original research question and look only for the answer to it. Most of the report is context. The answer is usually in three paragraphs, and sometimes it isn't there at all — which is a finding in itself.
Second pass: the numbers. List the numbers your decision depends on, and for each one verify the year, the source, and the methodology. A number without a year is unusable. A number where you don't know exactly what it measures (market by revenue? by unit count? including B2B?) is worse than no number at all.
Third pass: contradictions and uncertainty. The “what's an estimate” and “what wasn't found” sections are the most informative parts of the report. If the model left them empty, that's a warning sign, not a success.
Fourth pass: what's missing. The hardest and most valuable one. Is a competitor you know about missing? Is a channel that's essential in your industry missing? Is a regulation missing? Silence in the report doesn't mean the issue doesn't exist.
Clicking citations
The same rule as AI search with citations applies, just at a higher stake: click through every number your decision depends on, and every claim you'll use in a presentation to someone else.
Three typical failures: the number is somewhere other than the cited source; the source is from a different year than the report claims; the source talks about a different segment or country. The last one is the sneakiest — a market size for all of Central Europe used as the market size for a single country looks perfectly natural in a report.
Pull a verification checklist from the previous report.

Table with columns:
claim or number | where it is in the report | the link you cited
for it | exactly what I should find on that page to confirm it |
how much my decision rests on it (key / supporting / context)

Include every number, every claim about competitors, and every
claim about rules and obligations. Sort from key to supporting.

Separately, below the table, list claims whose source is
secondary (someone retold another source) — for those, note what
the primary source would be and where to look for it.

Don't judge whether it's true. Just give me a list to check.
You'll get a checklist that cuts an hour of verification down to twenty minutes, because you know where to go and what to look for. The section on secondary sources shows you which numbers rest on a chain of retellings. The methodology is in the tip on verifying facts with AI.
A second round for the gaps
A report is the start of a conversation, not the end. The second round is targeted: it doesn't aim at the topic again, it aims at the spots where the first round was shaky.
This is the report from the previous research run. Don't
research again, critique this output.

1. Where are the biggest uncertainties in the analysis — claims
   the conclusion leans on most heavily and that rest least on
   sources?
2. What would have to be true for the main conclusion to be
   wrong? List 3 specific conditions.
3. What sources are obviously missing — types of data that
   should exist for this question and aren't in the report?
4. What counterarguments would someone who believes the opposite
   raise?
5. Which claim in the report is most influenced by the source
   having an interest in a particular slant (a vendor, an
   industry association, a consulting firm selling the service)?

Be harsh. I don't want confirmation, I want to find where this
could break.
You'll get a critique of its own output, usually more specific than a critique from a person, because the model has the whole report in context. Point 2 is the most useful — a list of conditions that, once checked, tell you whether the conclusion holds.
Only then run a follow-up research query, and only on the gaps:
From the previous research, these specific things are missing:
1. [gap 1 — e.g. price tiers for players X and Y]
2. [gap 2 — e.g. return and warranty rules in this country]
3. [gap 3]

Do targeted research on only these three points. Don't rewrite
the context or the general market description.

For each point I want:
- a concrete finding with a link and the source's date
- how reliable that source is, and why
- if it can't be found from public sources, say so directly and
  suggest where else to find it (who to contact, what type of
  document to look for, what database)

I'd rather have three honest answers than ten guesses.
You'll get an addendum you can paste into the original report. The bullet point about the unknowable is more valuable than it looks: a list of “this you'll only find out with a phone call” is a valid plan for the next step.
Phase 4: five use cases
The skeleton from Phase 2 stays the same; what changes is the main body of the output and the boundaries. Five of the most common situations, with ready-made briefs.
Entering a new market
The most demanding type of research: it combines market, competition, channels, and regulation. The key is not trying to cover everything at once — focus on the barriers to entry, since those determine whether entering makes sense at all.
Deep research: market entry.

Question: what stands in the way of a company like mine entering
[country / region] with [product / service] through the
[online / retail / B2B] channel?

Context: [company size, industry, existing markets, what sets us
apart]. Decision: whether to enter within [12] months, or not.

Output:
1. Half-page summary: the three main barriers, and whether
   they're surmountable
2. Entry barriers broken down into: regulatory (what I need to
   comply with), operational (logistics, support, language),
   market-related (who's already there), and cost-related (what
   investment it requires) — with a source for each
3. Table: major players in the segment, their positioning, price
   tier (low/medium/high), channels, what sets them apart
4. Channels: how products of this type are actually sold in this
   country, and the concentration (one dominant platform vs.
   fragmented)
5. Three scenarios: fast entry, cautious entry via a partner,
   don't enter — for each, what argues for and against it, with
   a reference to the findings above
6. What I wasn't able to find out, and what I'd need to find
   another way

Rules: treat the regulatory section as informational, not as
legal advice, and for every requirement, state which regulation
or official source it's from.
You'll get material you can bring to a lawyer or a business partner — with specific questions instead of a vague “we want to enter Poland.” Always verify the regulatory section with an expert: AI proposes, the person approves.
A competitive map
The most common brief, and the most often phoned in. The difference between a list of companies and a map is that a map has axes.
Deep research: competitive map.

Question: who competes with [our product / service] in the
[scope] segment in the [geography] market, how are they
positioned, and where are the gaps in their offering?

Context: [our company, what sets us apart, who we sell to].

Output:
1. Table of players: name, who they sell to, price tier, main
   channel, what they present as their differentiator, where you
   got it from
2. Group the players into 3-4 clusters by strategy (not by size)
   and describe what distinguishes the clusters
3. Uncovered spots in the market offering: a customer segment,
   product type, or sales method nobody serves well — and what
   supports that (missing offerings, user complaints, a pricing
   gap)
4. Which players have made significant moves in the last 2
   years: new products, price changes, market entry or exit
5. Sources this overview can be kept updated from going forward

Don't include players who operate in the industry but don't
serve my segment — instead list them separately as "out of
scope" with a reason.
You'll get an overview that shows the market's structure, not just a list of names. Read point 3 skeptically: sometimes a gap is a gap because nobody wants that segment. Use point 5 for tracking the topic over time.
Pricing
Pricing research has a quirk: public prices are easy to find, actual transacted prices and margins almost never are. The brief has to account for that, or you'll get guesses passed off as data.
Deep research: price tiers.

Question: what price tiers does [product / service] sell at in
the [scope] segment in the [geography] market, and what
influences price the most in this industry?

Context: I'm considering [price / pricing model] and need to
know where that would place me.

Output:
1. Table: player, publicly listed price or range, what's
   included in the price, where the figure is from and as of
   what date
2. Price bands: how many exist in the market, what's typical for
   each, and what value the customer gets for that price
3. Pricing models used in the industry (one-time, subscription,
   volume-based, freemium) and how widespread each is
4. What pushes price up and down in this industry — specific,
   documented factors, not generic economic truisms
5. Explicitly separate: prices that are publicly listed versus
   prices that are estimates or secondhand

Don't recommend what price I should set. I want a map of the
market, not a pricing strategy.
You'll get a price map with documented and estimated figures kept separate. Point 5 is necessary — without it, an estimate looks exactly like a price list pulled from a website. And watch for “price on request” listings: the absence of a public price is information about the segment, not a gap in the research.
A strategy brief
When a report is going to a leadership meeting, the format is what changes most: leadership doesn't read eight pages, it reads half a page and asks about the numbers.
Deep research as material for a strategy meeting.

Question: [question]. The decision that will be made at the
meeting: [decision]. Audience: [company leadership / owner /
board], they already know [what they know], they don't know
[what needs explaining].

Output in exactly this order:
1. A one-page summary: the situation, the three most important
   findings, what they mean for the decision, what the main
   uncertainty is
2. Five numbers that will come up in the meeting — each with a
   source, a year, and one sentence on exactly what it measures
   (so it holds up if someone asks)
3. Risks: what could go wrong, how likely it is, and what it
   would mean — ranked by impact
4. Three questions the research didn't answer, that need to come
   up at the meeting
5. A detailed appendix with sources and specifics for anyone who
   asks

Write plainly, no marketing language. No "strategic opportunity"
or "synergy." Short sentences, concrete numbers.
You'll get material split between what gets read and what gets backed up. Point 2 is the most important: five numbers where you know the year and methodology carry more weight in a meeting than twenty numbers with no context.
Supplier due diligence
Vetting a counterparty before signing. Here it's especially important to separate what's publicly documented from mere impressions.
Deep research: supplier vetting.

Subject: [company name], [country], industry [industry].
Context: we're considering [type of partnership] with them at a
scale of [roughly].

Output:
1. Basic profile: when it was founded, who owns and runs it,
   where it operates, how big it is — a source and date for
   every data point
2. History and stability: how long in the industry, ownership
   changes, restructurings, renaming
3. Publicly traceable signals: lawsuits, insolvency, enforcement
   actions, sanctions, regulatory actions, repeated customer
   complaints — a source for each, and whether the matter is
   closed or ongoing
4. References and reputation: who talks about them publicly, how,
   and whether it's independent sources or their own materials
5. Red flags: specifically what should concern me
6. What can't be found from public sources and what I need to
   request directly from them or from official registries

Rules: strictly separate documented facts from impressions
gathered from discussions. Be especially careful with negative
claims — if you don't have a solid source, present it as an
unverified mention, not as fact.
You'll get a profile with facts and signals kept separate. Take two things seriously: don't repeat a negative claim about a company without a solid source — it could be false and carry legal consequences. And go through public registries yourself; AI can point you toward them, but you open the business or insolvency registry filing with your own hands. Once you're past vetting, the follow-up tip is reviewing a contract before signing.
Phase 5: combining it with your own company data
This is where value shows up that research alone can't provide. A report about the market is interesting; a report compared against your own numbers is a decision.
What to combine, and how
Typical pairs: competitor prices against your price list. Market channels against where your customers actually come from. Segments from the report against your revenue structure. Risks from the research against how prepared you are for them.
One rule matters above all: internal figures belong strictly on a paid or business account with contractual data protection, not in a freely available chat. And anonymize whatever you can — “client A” instead of client names, order-of-magnitude ranges instead of exact amounts. And the rule for numbers applies here too: totals get computed by a script over the export, not by a model in a chat.
I'm attaching two things: the market research report and an
overview of our own numbers (anonymized export).

[report]

---

[our data: e.g. revenue structure by segment, our products'
price tiers, where customers come from, margins by category]

Compare them and return:
1. Where we stand against the market: on price, by segment, by
   channel — specifically, with numbers from both sides
2. The three biggest mismatches: where our assumption about the
   market diverges from what the research says
3. Where we have a strong position that the report isn't showing
   we're using
4. Where our segment is most vulnerable given what competitors
   are doing
5. What data we're missing to do this comparison properly

Don't compute or estimate any new numbers — work only with what's
in the materials. Where you don't have data for a comparison,
say so.
You'll get a comparison where point 2 tends to be the most uncomfortable and most useful. The last paragraph of the prompt is necessary: without it, the model computes an “approximate market share” and similar figures that look plausible and have no backing.
How much weight to give each side
Your data is precise but narrow — you only see your own customers. The research is broad but imprecise. When they contradict each other, your data usually holds for you and the research holds for the market, and the gap between them is the interesting information: it means you're different from the average, and it's worth finding out why.
Ongoing updates
For topics you return to (competitors, pricing, regulation), treat research as a recurring task, not a one-off project. Save the brief along with the date, and run it on a sensible cadence — competitors quarterly, pricing according to how fast the industry moves, regulation depending on what's coming down the pipe. Claude supports scheduled tasks and routines, so the overview can be generated on a schedule.
Most of the information is then in the difference between two rounds. Put both reports side by side and have it list what substantively changed, which claims are the same in both and backed by the same sources (the firmest ground), which have different numbers (candidates for verification — the difference is usually methodology or year), and what disappeared from the first report. Judge for yourself what's a real shift and what's noise.
Common mistakes
- Submitting a topic instead of a decision. “Competitors in Poland” returns an essay. A brief that makes clear what you're deciding between and on what timeline returns usable material. This single change improves the result the most.
- Not specifying the output format. Without a defined structure, you get text you'll rewrite anyway. A table, a list of risks, three scenarios, a half-page summary — say so up front.
- Not clicking the citations behind numbers. Hallucinations happen most often with numbers and are hardest to spot, because they look precise. Verify the year, the source, and the methodology — especially whether the number actually applies to a different segment or country.
- Treating a retelling as a source. A statistic copied from an article that copied it from a report tends to have changed by the third handoff. When the report cites a roundup, follow up and ask for the original work.
- Skipping the second round. The first research run mostly shows you what to ask the second time. A targeted follow-up on three specific gaps is cheaper and more precise than a new broad run.
- Putting internal figures into a free chat. Price lists, margins, and client data belong strictly on a paid or business account with contractual data protection, and even there only after anonymizing.
- Letting AI make the call. A report can tell you what the market is doing. Whether you enter, what price you sell at, and who you sign with is your decision — AI proposes, the person approves.
The best tools
- Claude — deep research with web search and citations on every claim; you can convert the report straight into a table or a leadership summary, and with a project that carries persistent context, you don't have to describe your company again.
- Other major AI tools — most of them offer a similar mode; they differ in depth and how they surface sources. For an important decision, it's worth running the brief in two tools and comparing.
- AI search with citations — for follow-up questions between research rounds; faster than a full run.
- Industry and statistical databases — still the primary source for hard numbers. AI points you toward them; do the verification there.
- Public registries — the business registry, insolvency registry, contracts register, and similar sources for due diligence should always be opened yourself; they're primary documents, not retellings.
- Notion — a place to save the report along with the date and the brief, so it can be found and compared against a new one a quarter from now.
What you get out of it
- Time: a week of gathering sources turns into tens of minutes of runtime, an hour of verification, and half an hour for a second round. For recurring research, the savings are even bigger, because the brief is already written.
- Money: indirectly, but noticeably — a decision on market entry, pricing, or a supplier that rests on verified numbers instead of an impression from three websites gets redone less often. The most expensive outcome is a market entry where you only discovered unknown barriers six months in.
- Peace of mind: a report with links can be sent to colleagues, put on the table, and defended. “I read it somewhere” can't be.
- Quality: broader coverage than you'd reach by hand, especially in foreign-language markets and among less visible players. And better questions: the first round of research mostly shows you what you assumed and what you actually don't know.
Pro tip
Submit the same question twice, spaced apart and worded slightly differently — ideally in two different tools. Claims that show up in both reports with the same sources are usually solid; ones that show up only once are candidates for verification. For a decision worth a week of work, a second run is the cheapest twenty minutes you'll spend.
And one closing rule: research doesn't reduce uncertainty, it makes it visible. A good report doesn't tell you what to do — it tells you what you know, what you only suspect, and what you'd need to find out to decide better. If it turns out the key number rests on a single two-year-old estimate, that's not a failure of the research. It's the single most valuable thing you learned.
Want to go deeper? The handbook has a whole chapter on it — AI and automation.
Similar tips
A custom travel itinerary: day by day, without hours of planning
A complete guide with copy-paste prompts: from a constraints-based brief through a day-by-day itinerary with transfer times and a rainy-day plan B, to a booking checklist, verifying opening hours at the source, and sharing the plan with family.
Voice typing in Google Docs
Ctrl+Shift+S
Ctrl+Shift+S starts dictation — in English, free, right in the browser. Ideal for rough first drafts.
A PhD student with AI: research, teaching, and grading
A complete how-to with prompts for a PhD student's week: a Monday research routine with citations, a paper library that only answers from your own sources, prepping exercises from your own material, grading tests against an answer key and handwriting alike, templates for admin — and where AI has to stay strictly an advisor.
Liked this tip?
I send one like it every week by email. Two minutes to read, hours saved.
1 tip a week · no spam · unsubscribe in one click