Tips & tricks · AI · Everywhere · ~a clear picture of your money in 1 evening
A personal budget in one evening: bank statement + AI
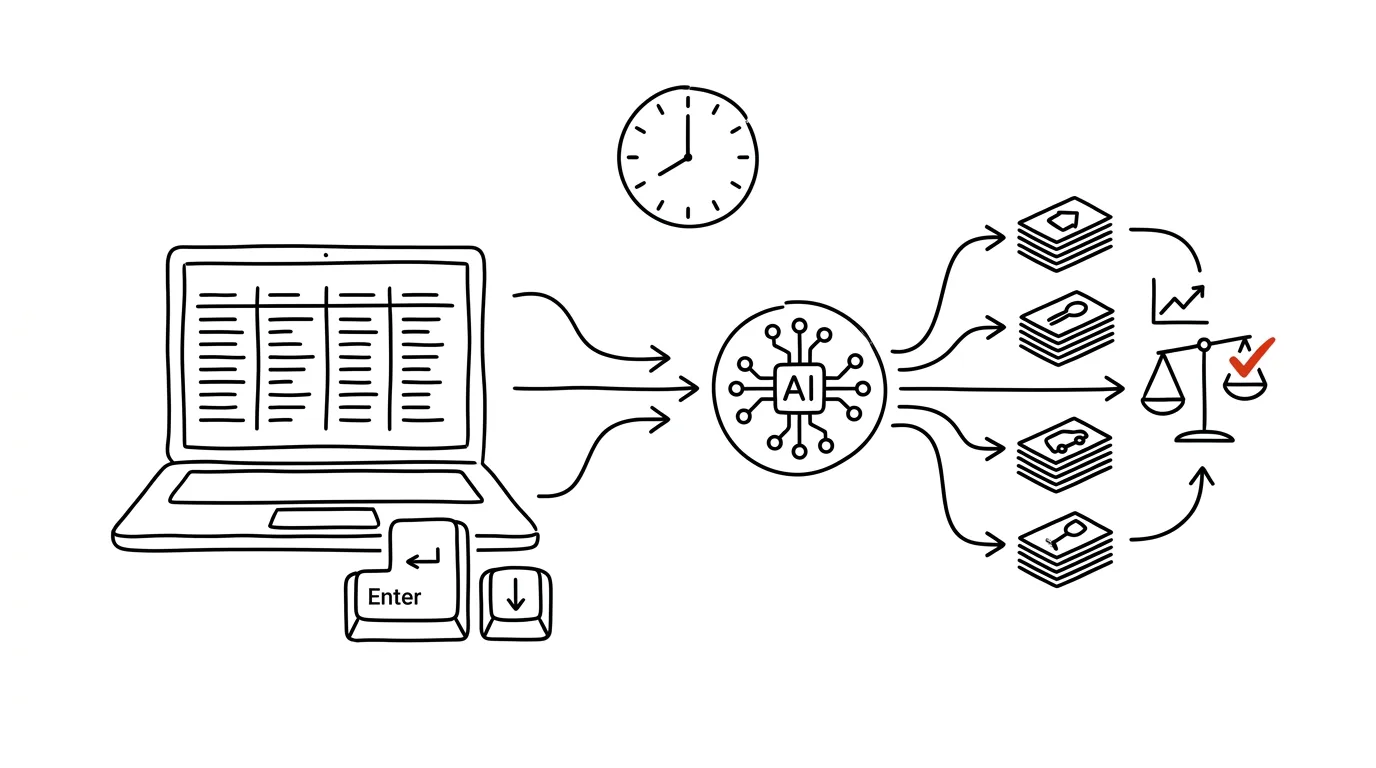
Most people don't have a budget not because they don't want one, but because they picture months of manually logging every purchase. Yet all the data already exists — your bank has been keeping it for years, line by line, with the date, the amount, and the counterparty. All you have to do is export it and have it sorted. In a single evening you can build a complete picture of your money: how much comes in, where it goes out, and whether anything's left at the end of the month — or whether you're quietly eating into your reserve.
This guide isn't about frugality. It's about visibility — about turning a thousand lines of a statement into a handful of numbers you can actually make decisions from. It walks you through exporting from your online banking, anonymizing and categorizing the data, building a monthly summary, uncovering forgotten payments, setting up a permanent template, and a routine that keeps it alive past the two-month mark. Each phase comes with a copy-paste prompt; just fill in the brackets.
Two rules apply across the whole guide. A financial statement is one of the most sensitive things you own — it shows where you live, where you shop, which doctor you've seen, and who you send money to. It belongs only in a paid or business account with contractual data protection, never in a free chat, and identifiers get stripped out before you upload it. And second: AI proposes, a human approves. Categorization can go to the machine, but canceling a subscription, moving money, or changing a standing order stays with you, done yourself in your own online banking.
A typical scenario
Klára is twenty-nine, freelances, and has a nagging feeling that “money just disappears.” About 48,000 Kč lands in her account each month; by the end of the month there's a few thousand crowns left, sometimes nothing. Where it goes, she doesn't know — she just has a sense that “a lot goes on food.” She's tried budgeting twice before: once an app she logged into faithfully for three weeks and then quit, once a spreadsheet she filled in exactly once.
One evening she downloads her statement for the past twelve months, strips out the account numbers and names, has it sorted, and within an hour has an answer that doesn't exactly please her but does help.
Subscriptions: eleven separate recurring payments totaling 1,340 Kč a month — over sixteen thousand a year — and she hadn't used three of those services at all in the past six months. Food broke down into two line items that together explained the “a lot goes on food” feeling: groceries at 4,900 Kč and delivery at 6,200 Kč a month. That second number she wasn't expecting at all; her own guess had been “maybe two thousand.” And most importantly: three months running she'd had negative cash flow without noticing, because there was always some money sitting in the account — except it was money left over from a better spring, not from those three months.
She canceled four subscriptions, set a monthly cap on delivery, and set up a sheet in Google Sheets where, every first weekend of the month, she uploads a new statement and adds one row. Six months later she can see that delivery has dropped to 2,400 Kč, and that her cash flow reliably dips into the red every December and June — which isn't a surprise anymore, just information she can plan around ahead of time. No diet, just visibility.
Phase 1: Exporting from your bank — getting to the data
The whole guide rests on a single file. The good news: it takes three minutes and costs nothing, because it's your data, and your bank is already holding it.
Where to find your statement
In your bank's online banking, look for something called “History,” “Transactions,” “Activity,” or “Statements.” You don't want the monthly PDF statement (that's for reading, not for computing) — you want an export to CSV or XLSX. It's usually tucked under a download icon or an “Export” button above the transaction list. Every major bank supports this, they just each call it something slightly different. Mobile apps often lack the export option or limit it, so sit down at a computer for this.
Download twelve months, not three. A full year is the only window in which you'll see things that happen once a year: insurance premiums, annual passes, taxes, vacations, holiday shopping. Analyze a single quarter and you get a distorted picture, and then you wonder why your budget never adds up. If your bank won't let you download a whole year at once, export it month by month or quarter by quarter and merge the files afterward.
What's in the file, and what to check
A typical row contains the date, the amount (expenses as a negative number), the counterparty's name, a reference number, the payment type, and a note or memo to the recipient. That's plenty. Before you upload the file anywhere, open it and check three things that most often cause trouble with these exports:
- The delimiter. Bank exports commonly use a semicolon instead of a comma — especially when your bank uses a comma as the decimal separator. If the file opens in your spreadsheet app as a single column, this is why.
- Encoding. Older exports may not be saved as UTF-8, which shows up as garbled characters wherever there's an accented name. Re-save the file as UTF-8 CSV, or you'll end up with categories full of broken names.
- Decimal points and thousands separators. Depending on your bank and locale, a number might come out as “1,234.50” or as “1 234,50” — either way, a spreadsheet app can misread it as text instead of a number. Either fix it on import, or spell out the exact format in the prompt.
Multiple accounts and cards
If you have a checking account, a savings account, and a credit card, export all of them — but note right away which transfers are between your own accounts. Those aren't expenses or income, they're internal moves; if you counted them, every transfer into savings would look like a purchase and reliably wreck your whole analysis. You'll recognize your own accounts by the account number or counterparty name, and you'll exclude them in the next phase.
If you're not sure what's actually in the file, start with a diagnosis. Paste in just the first few rows, not the whole statement.
Here's the header of my bank statement — the first 8 rows, including
column names. This is already anonymized data.

[paste 8 rows]

Tell me what's in this file:
1. What each column means, and which one is the amount, the date,
   and the counterparty name.
2. What the delimiter is, what the encoding is, and how decimals
   and thousands are written.
3. How to tell an expense from income in this format.
4. Which columns are useless for budgeting and can be deleted.
5. What's missing from this export for it to work as a budget
   (e.g. a missing payment type or empty descriptions).

Don't calculate anything yet, just describe the structure.
You'll get back a description of the file and a list of columns to drop. Point 5 is more useful than it looks — some banks export card payments with an empty counterparty field and put the merchant name in the note instead; catching that now saves you confusion during categorization.
Phase 2: Anonymization — what to strip out before you upload it
Don't skip this. A statement is the most detailed diary of your life that exists: where you live, your employer, your doctors, your hobbies, who you lend money to, where you were last Friday night. For a budget analysis, though, you only need a fraction of that.
What to delete and what to keep
Delete entirely: account numbers (yours and the counterparty's), payment reference numbers, addresses, national ID or Social Security numbers, and the full names of individuals. None of it has any value for building a budget.
Keep: the date, the amount, the payment type (card, transfer, direct debit, withdrawal), and a rough description that lets you tell what kind of purchase it was — a store chain's name, “pharmacy,” “transit,” “streaming service.”
Think carefully about: names that reveal something sensitive. Your employer, a specific doctor or therapist, a lawyer, an ex-partner you send money to. Replace them with a generic description: “salary,” “healthcare,” “loan payment,” “person A.” It won't hurt the analysis — what matters for a budget is that money went out on Monday for healthcare, not who it went to.
Anonymize with a script, not by hand
With a year's worth of statements — a thousand rows — manual deletion is a chore. It's faster to have a small script written that edits the file right on your own computer — so the original version never goes into the chat, only the result. You don't need to know how to code, just how to run the script; the process is the same as in the tip on scripts for non-developers.
Write me a Python script that prepares my bank statement for
further processing. The script will run locally on my machine.

Input: file statement.csv, delimiter semicolon, encoding
[UTF-8 / Windows-1252], decimal comma, amounts with a negative
value for expenses.
Columns: [list the column names].

The script should:
1. Load the file and convert amounts to numbers (handle thousands
   separators and decimal commas).
2. Delete these columns: [account numbers, reference number, address].
3. In the counterparty name, replace these strings with a generic
   description: [list, e.g. employer's name -> "salary"].
4. Add a "month" column in YYYY-MM format.
5. Flag rows where the counterparty is one of my own accounts
   [list of identifiers] with the value "internal transfer".
6. Save the result as statement-anon.csv in UTF-8.

Write a comment for each step explaining what it does.
The script must handle empty cells without breaking.
You'll get back a script that's a few dozen lines long. Before you run it on real data, check two things: whether the totals after converting amounts match what your bank shows, and whether any names really are gone from the file after the replacement. Open the result and skim through it — five minutes of checking is cheaper than uploading a statement with your doctor's name still in it.
Where to do this work
Even an anonymized statement is a sensitive document. Work in a paid or business account with contractual data protection, not a free chat, and delete the file from the conversation once the analysis is done. If you want to be as careful as possible, have the entire analysis script written for you and run it locally — then nothing leaves your computer except the file's header.
Phase 3: Categorization — from a thousand rows to ten numbers
Categorization is the step that takes a weekend by hand and ten minutes with a machine. It's also the step that decides whether the result will be any use to you at all.
You choose the categories, not the model
The default categories in budgeting apps are built for an average person who doesn't exist. A useful category is one you can actually make a decision about. If you know you want to tackle food spending, “food” isn't enough — split it into groceries, restaurants, and delivery, because each of those three gets influenced differently. On the flip side, tracking “office supplies” separately doesn't make sense if it only adds up to a few hundred a year.
A solid starting skeleton: housing (rent, utilities, internet), food (groceries, restaurants, delivery), transportation, subscriptions and services, health, kids, clothing, entertainment and hobbies, gifts, one-off big expenses, loan payments and savings, other. Ten to fifteen categories is the most you can realistically maintain; at thirty, you stop understanding your own spreadsheet.
Set aside one-off big expenses as their own category — a washing machine, a bike, a vacation, a security deposit. Without that, one month throws off your entire average and you're left feeling like you live expensively when really you just bought a washing machine once.
I'm attaching an anonymized bank statement covering [12] months
(columns: date, amount, payment type, description, month).

Sort every transaction into one of these categories:
[housing, food - groceries, food - restaurants, food - delivery,
transportation, subscriptions and services, health, clothing,
entertainment, gifts, one-off big expenses, loan payments and
savings, other]

Rules:
- Don't count rows flagged as internal transfers at all — just
  list them separately at the end.
- Don't categorize income as an expense; put it in its own group
  and separate regular income from irregular income.
- If you're not sure about a payment, DON'T GUESS. Put it in an
  "uncategorized" group and list it separately.
- Flag one-off expenses over [5,000] on their own, even if they
  belong to another category.

Give me:
1. A table: category, total for the whole period, monthly average,
   number of transactions, share of total expenses.
2. The "uncategorized" list with date, amount, and description.
3. The ten largest individual expenses for the period.
You'll get a complete breakdown of spending, plus two lists to work with next. The ban on guessing is the key part — without it, the model quietly sorts unclear payments by vibe, and you end up with numbers that look precise but don't add up. The “uncategorized” list is usually fifty to a hundred rows, and you can fill it in by hand in five minutes; typically it's payments with an empty description, ATM withdrawals, and transfers to individuals.
Rules you'll reuse across months
So next month's categorization isn't starting from zero again, have your first analysis produce a mapping table: which word in the description assigns a payment to which category. It's a plain list, but it's the core of the whole routine.
Based on how you just sorted my transactions, build me a mapping
table of rules that I'll use every month.

Format: keyword or pattern in the description | category | note

Conditions:
- Base it only on payments that actually appeared in my statement.
- Use the most general patterns possible (a chain's name, not a
  specific branch), so the rule still holds next time.
- For each rule, note how many transactions it would cover in my
  annual statement.
- List separately any payments that recur but don't map well to
  a rule, and explain why.
- Sort the rules from most common to least.

At the end, tell me what share of my transactions this rule set
would cover automatically.
You'll get a table to save alongside your budget. For most people it covers eighty to ninety percent of transactions — you handle the rest by hand. And once the rules are written down, you can have the same logic turned into a script and categorize entirely without a chat.
Phase 4: Monthly summary — income, expenses, and cash flow
Now comes the number this whole exercise exists for. Not “how much did I spend on food,” but whether every month pays for itself, or whether my reserve is paying for me.
Cash flow isn't your account balance
Cash flow is the difference between what came in during a month and what went out. Your account balance is something entirely different — it's the sum of everything that's accumulated over the account's whole history. Inflow minus outflow doesn't equal your balance, and confusing the two is the most expensive mistake in personal finance.
You can have a comfortable-looking balance sitting in your account and still have negative cash flow five months running. The account looks healthy because it's draining slowly, and you don't feel like anything's wrong — until that balance runs out. Positive cash flow means the month is paying for itself. Negative means what you saved earlier is paying for you. Either can be fine — a negative month because of a vacation is normal — but you need to know about it.
So don't look at a single number — look at a run of twelve. Only in a series can you see the difference between “one month went worse” and “I've been running a deficit against myself for six months.”
Build me a monthly summary for the whole period from the sorted
transactions.

For each month, calculate:
- total income (regular and irregular, separately),
- total expenses,
- expenses broken down by category,
- cash flow = income minus expenses,
- cash flow WITHOUT one-off big expenses (so I can see what my
  normal month-to-month spending looks like).

Don't include transfers between my own accounts in the calculation.

Then write me a summary:
1. How many months had negative cash flow, and which ones.
2. What my average monthly baseline spending is (median expenses,
   not the mean — and explain why they differ in my case).
3. The three categories that swing the most between months.
4. Which months are consistently the most expensive for me, and why.

For every number, say how many transactions it's built from.
Don't give me recommendations, just the numbers and description.
You'll get back a table of twelve months and a summary. Point 2 is usually the most useful: the median tells you more than the mean, because a single washing-machine purchase pushes the mean up by a good chunk, while the median stays put where your actual normal spending is. And point 4 is the one that lets you stop being surprised every December.
One check before you trust the numbers: add up income and expenses for one specific month and compare it against your online banking. If it doesn't match, the most common cause is that transfers to your own savings account snuck into the expenses, or that amounts with thousands separators got misread. For more on working with spreadsheet data, see the tip on analyzing data with AI.
Ratios, not just absolute numbers
Once you have a monthly series, it pays to recompute expenses as a share of income. “Housing costs money” says nothing on its own; “housing is 30 percent of income” does, because it lets you compare across years and across months where you earn different amounts — which freelancers with variable income appreciate especially. Have a percentage-share column calculated alongside the table and watch it just as closely as the raw amounts.
Phase 5: Subscriptions and recurring payments
This is usually where the fastest money of the whole evening gets found. Recurring payments share one trait: you decided on them once, often years ago, and they've been leaving the account on their own ever since, without asking.
Find them automatically
Don't rely on memory. Most people can recall four or five subscriptions and actually have ten to fifteen in their statement — because they get systematically forgotten, especially the annual ones.
Go through my annual statement and find all recurring payments.

Treat a payment as recurring if it went to the same or a very
similar counterparty at least [3] times over the period, in a
similar amount, at a regular interval.

For each one, give me:
- the counterparty description,
- the typical amount and whether it changed during the year (if
  so, when and by how much),
- the cadence (monthly, quarterly, yearly),
- how many times it occurred over the period,
- the total for the period and the annualized total,
- the date of the last payment.

List three groups separately:
A) payments that look like digital-service subscriptions,
B) recurring payments that aren't subscriptions (rent, insurance,
   loan payments, savings),
C) yearly or twice-yearly payments that only occurred once or
   twice over the year.

At the end, give me the total: how much group A costs me per year,
and how much all recurring payments together cost.
You'll get a list that's usually the evening's first unpleasant surprise. Group C is the one people forget the most — antivirus software, a domain name, insurance, a membership, an annual toll pass or vehicle registration. Check one thing by hand: the model sometimes flags three purchases from the same store as a recurring payment, so look at the actual payment dates for each item.
Decide what to do with them
The list alone saves nothing. What's useful is going through it once, properly, with a clear question for every item.
Take my group A list of recurring payments and turn it into a
decision table I can go through.

Columns:
service | monthly | annually | last paid | question to ask myself |
what to check before canceling

In the question column, write a specific question for that service,
not a generic phrase — e.g. "when did I last open this" for
entertainment, or "do I already have this in another service" for
overlapping subscriptions.

In the last column, write what I should verify before canceling
anything: whether something else depends on it, whether it's an
annual payment I've already paid for this year, whether the service
has stored content on it.

Sort by most expensive annually. Don't recommend canceling anything
yourself — just prepare the questions, I decide.
You'll get a table you can work through in ten minutes. The last paragraph of the prompt is there on purpose: canceling a payment is something you do yourself, in your own online banking or directly with the service, not something an assistant does. Partly because nobody else should be doing it, and partly because canceling surprisingly often turns up something you'd forgotten depended on the service — a shared family account, a domain, photo backups. And be careful about canceling mid-subscription: for annual payments it's usually worth letting the current period run out and just turning off auto-renewal.
Phase 6: A permanent template and a monthly routine
This is where most people stop — and that's exactly why most people don't have a budget two months later. A one-off analysis is interesting, but it's a snapshot, not a gauge. The value only comes from repeating it.
A template in Google Sheets
The simplest permanent home is a spreadsheet: one sheet with all transactions, one with a monthly summary, one with your category settings. You don't have to build it by hand.
Design me the structure of a budget spreadsheet for Google Sheets
that I'll update every month.

I want three sheets:
1. "transactions" — this is where I paste the bank export. Columns:
   date, month, amount, payment type, description, category, note.
2. "summary" — a monthly summary: rows are categories, columns are
   months, cells hold the totals. Below the table, rows for: total
   income, total expenses, cash flow, cash flow without one-off
   expenses.
3. "categories" — a list of my categories and the mapping rules.

Tell me specifically:
- what formulas to put in the "summary" sheet so the totals
  calculate themselves by category and month (include which cell
  each one goes in),
- how to set up a category dropdown list in the "transactions"
  sheet,
- how to color-code months with negative cash flow,
- how to make sure the formulas don't break when new rows get
  added.

Assume I'm a beginner: write it as a step-by-step process.
You'll get back a walkthrough complete with ready-made formulas. Watch for two things: conditional sum functions are sensitive to the exact wording of a category, so the dropdown list isn't cosmetic, it's necessary — one stray “Food” next to “food” and your total is off. And check the formulas by hand against one month right after you set them up, before you start trusting them. If you'd rather have a click-through summary instead of formulas, see the tip on a pivot table in two minutes.
Or a database in Notion
If you already keep notes in Notion and want your budget alongside them, a database makes sense — mainly for the filters and monthly views.
Design me a personal budget database in Notion.

Describe:
- what properties the transactions database should have and of
  what type (date, number, select, formula, relation),
- how to set up a property that automatically turns the date into
  a month, so I can group by it,
- what views I should create: current month, category comparison,
  recurring payments only, uncategorized transactions only,
- how to set up a cash flow summary for a selected month,
- what page template to use for the monthly close-out, and what
  checklist should be on it.

Write it as a process I can click through, not as theory.
Don't assume I already know Notion formulas.
You'll get a database design with views included. Notion is more comfortable for browsing and worse at crunching thousands of rows — if you have a lot of transactions, leave the calculations in a spreadsheet and keep only the monthly summary in Notion. A page template works well for the monthly close-out; see templates in Notion databases.
A ten-minute routine
The rhythm is simple: the first weekend of the month, ten minutes, always the same. Download the statement, run the same prompt, add a row, glance at three numbers. The key is that you don't reinvent the prompt each time — you save it and just change the period.
This is my monthly budget prompt. I'm attaching an anonymized
statement for [month] and my mapping rule table.

1. Sort the transactions using the attached rules. Anything that
   doesn't match a rule goes into "uncategorized," listed out —
   don't guess.
2. Calculate for this month: income, expenses by category, cash
   flow, and cash flow without one-off expenses.
3. Compare against previous months, which I'm attaching as a
   summary:
   - categories that grew or shrank by more than [20]%,
   - new recurring payments that didn't appear before,
   - recurring payments that are missing this month,
   - payments that stand out from my usual pattern.
4. Give me a three-sentence summary: what changed this month.

Don't give me savings advice. I want facts and deviations.
You'll get a monthly close-out back in a form you can copy into your spreadsheet in two minutes. Point 3 is the core of the routine — only a comparison against previous months reveals that delivery spending is climbing for the third month running, or that a subscription snuck in that you don't know about. Save the prompt somewhere you'll find it again — ideally in a project with persistent context, where your mapping table can live alongside it.
So you don't miss the date, set a reminder — either a plain recurring calendar event, or a scheduled routine that messages you on the first weekend of the month to say it's time. Ten minutes a month is the entire price of keeping the budget alive.
Phase 7: The annual view, trends, and a chart
After half a year of the routine, you have something a one-off analysis never gives you: a series. And a series shows things a single month never will.
Trends and seasonality
I'm attaching my monthly budget summaries for [period]. I'm
interested in the trend, not individual months.

Evaluate:
1. Which categories are growing long-term and which are shrinking —
   for each, give the percentage change between the first and last
   month, and whether the change is gradual or sudden.
2. Seasonality: which months are consistently the most expensive,
   and why (which categories are responsible).
3. Cash flow trend: how many months were negative, whether the
   situation is improving or getting worse, and the sum of cash
   flow over the whole period.
4. The share of fixed (recurring) expenses out of the total — and
   how that share is changing.
5. How much I'd need monthly to cover just the expenses I can't
   cancel quickly.

For every conclusion, state which numbers it's based on. Where the
period is too short for a conclusion, say so instead of guessing.
You'll get back an analysis where point 5 is the most valuable. That number — how much you need every month for nothing to fall apart — is the foundation for deciding on a reserve, how many freelance jobs you need, and whether you can afford three months without income. The prompt's final line is insurance against the model drawing trends out of five months of data; that happens regularly with short series.
An artifact with a chart
A table of numbers is worse than a picture. Have a small page with a chart built for you — in Claude that's an artifact, a mini-app right in the chat that you can save and reopen.
Build me an artifact: a simple page showing an overview of my
budget. I'll give you the data as monthly summaries, attached.

I want it to have:
1. A bar chart of cash flow by month — positive and negative
   months color-coded, with a zero line.
2. A chart showing the trend of three categories I pick from a
   dropdown (pull the data from my summary).
3. A row of key numbers at the top: average monthly expenses
   (median), share of fixed expenses, number of negative months.
4. A table below the charts, sortable by category and amount.

Labels in English, amounts with a thousands separator.
No advice or judgment, just a display of my data.
Make sure it works on mobile too.
You'll get a working page with charts that you open every time after the monthly close-out. Check one thing: whether the chart is actually using your numbers from the summary, and not sample data the model filled in while building the interface — compare one month against your table. Don't put individual transactions into the artifact, monthly summaries are enough; less data, fewer worries.
What to do with it next
The annual view is the moment bookkeeping turns into decision-making. Three questions worth asking at this point: how many months of expenses my reserve covers, which single category cost the most over the year without me noticing, and what I'd need to change for cash flow to be positive even in my worst month. The answers to those aren't work for a model anymore — you have the numbers, the rest is your decision.
Common mistakes
- A one-off analysis with no routine. The most common and most expensive mistake in the whole process. One evening gives you a great snapshot, but it's useless two months later — because a decision like “I'm canceling delivery” slides back into old habits without ongoing measurement. Without the ten-minute monthly routine, the whole evening is just an interesting experience.
- Analyzing three months instead of twelve. Annual payments, vacations, the holidays, and taxes don't fit into a quarter. A short window creates a false picture of a “normal month” that doesn't actually exist.
- Confusing cash flow with your balance. An account that still has some money in it isn't proof the month worked out. Inflow minus outflow is a different number than your balance, and only the first one tells you whether the month is paying for itself.
- Uploading an unanonymized statement to a free chat. A bank statement is the most detailed diary of your life there is. Account numbers, names, and reference numbers out, work only in a paid account with contractual data protection — and delete the file from the conversation once the analysis is done.
- Letting the model guess on unclear payments. Without an explicit instruction to “don't guess, put it in uncategorized,” you get a table that looks precise but has numbers quietly scattered into the wrong buckets. Ten minutes of manual sorting is cheaper than not trusting your own budget.
- Forgetting to exclude transfers between your own accounts. Otherwise every transfer into savings gets counted as an expense, and it wrecks both your cash flow and every ratio built on it.
- Thirty categories. You won't use a budget you don't understand. Ten to fifteen categories you can actually make decisions about will serve you better than a perfect breakdown you fill in exactly once.
The best tools
- Claude — categorizes the CSV, builds monthly summaries, and produces an artifact with a chart right away so you can see month-by-month trends without assembling a single formula; it can also handle a query like “my ten biggest expenses last year.”
- Google Sheets — the best permanent home for a budget: totals by category and month, dropdown lists, and conditional formatting for negative cash flow.
- Notion — if you want your budget alongside your other notes: a database with categories, filters, and a monthly close-out template.
- A Python script on your own computer — anonymization and categorization without the data ever leaving your machine; a model can write it, and you can run it even without knowing how to program.
- A scheduled routine or a calendar reminder — a nudge for the first weekend of the month. Without it, the routine dies out by month three no matter how nice the spreadsheet is.
- Bank apps with built-in categorization — make sense as a supplement once you already know which categories you actually want to track; their default breakdown is usually too coarse for your own decisions.
What you get out of it
- Time: one evening instead of months of manual logging, then ten minutes a month. Keeping a budget by hand is hours of work a week, which is exactly why almost nobody sticks with it.
- Money: forgotten subscriptions and duplicate services turn up for almost everyone who runs this process; for people with ten or more recurring payments, it commonly adds up to real money over a year. It's often the fastest money you'll make all year.
- A clear picture: for the first time you see the whole year together, not individual payments. That's the difference between “that was expensive” and “this costs a specific amount every year.”
- Peace of mind: negative cash flow spotted in August gets handled very differently than negative cash flow spotted in December, once the reserve has already run out. And “how much I need monthly to get by” is the only reliable basis for a reserve.
- Quality of decisions: instead of feelings, you have ratios. Deciding whether to move, take on a new contract, or make a big purchase looks different once you know exactly how much of your income is actually left over today.
Pro tip
Once you have a year of data, try one experiment: have it calculate what your cash flow would look like if you cut a single category by a third. Not everything at once — one category. For most people it turns out that one or two line items are the whole problem while the rest of the budget is fine, and that cutting everywhere is needless suffering. Which category to pick is your decision; the model just shows you how much the numbers move.
And one closing rule: AI proposes, a human approves. Categorization, totals, and charts can all go to the machine. But canceling a subscription, changing a standing order, moving money, and deciding what you can afford in life — that stays with you, in your own online banking, with your own signature. A budget is a tool for seeing, not a tool that decides for you.
Want to go deeper? The handbook has a whole chapter on it — AI and automation.
Similar tips
Look up a word with three fingers: the built-in dictionary
Ctrl+Cmd+D
Tap a word with three fingers (or Ctrl+Cmd+D) and up pops a definition, translation, and Wikipedia entry — without leaving the text.
Text replacement: type “addr” and the whole address pops out
macOS can replace short shortcuts with long text system-wide — in email, browser, and chat alike. Set it up once, works everywhere.
Space scrolls one screen at a time
Shift+Space
Space moves the page down by one screen, Shift+Space moves it back up. The most comfortable way to read long text without a mouse.
Liked this tip?
I send one like it every week by email. Two minutes to read, hours saved.
1 tip a week · no spam · unsubscribe in one click